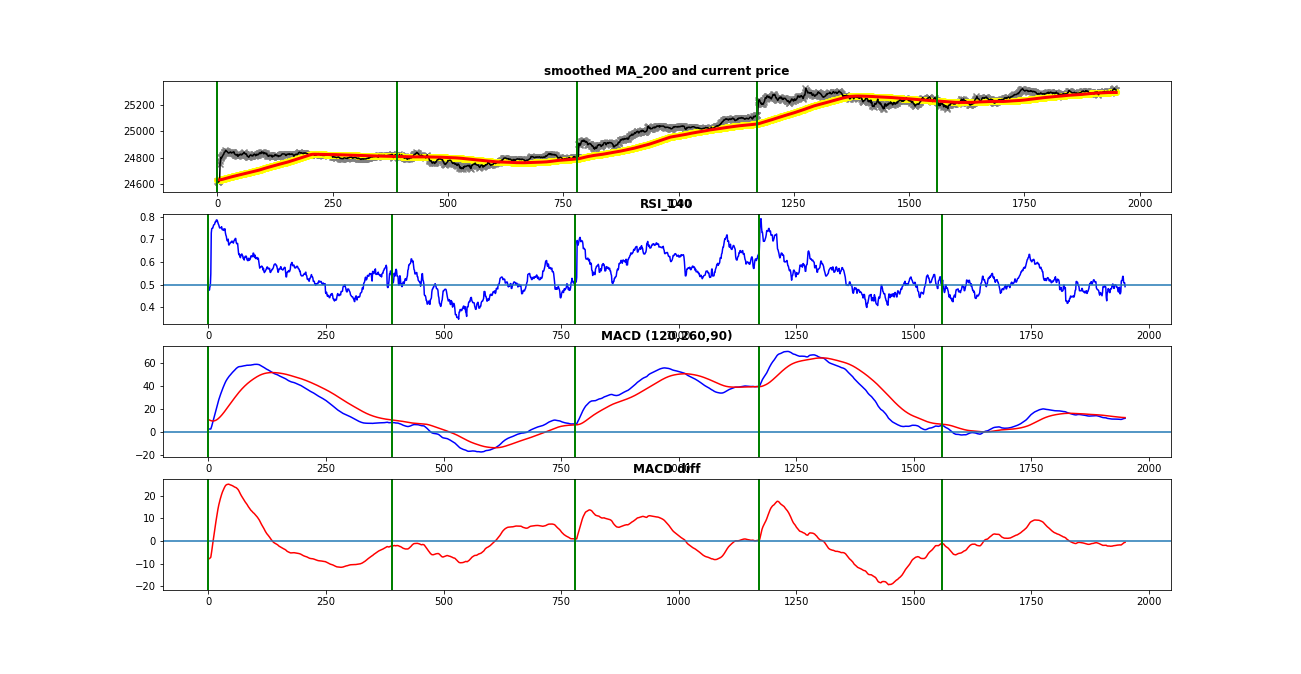
This is the 1-min record for the week 29.05.18 - 01.06.18
Days are approximately separated by vertical lines (It is considered one day with 525 minutes).
Raw
prices are plotted with a gray x-mark as well as MA - 200min(yellow
curve). However, my strategy is to smooth the raw data and construct the
plots for MA - 200min, RSI - 140min, MACD(260min,120min,90min).
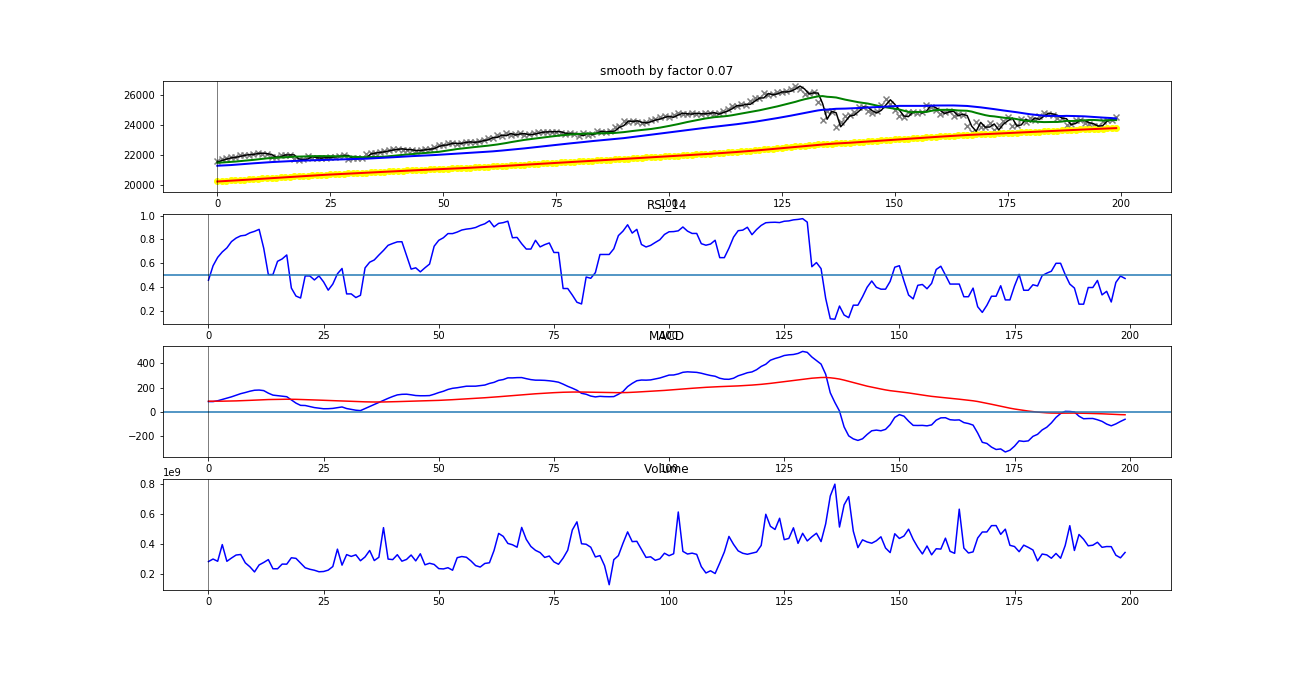
In the next plot, I show the 1-day record for last 200 days. In the
upper chart, green, blue and red lines represent MA for 20-, 50- and
200- days, respectively. In the second chart, it is plot the RSI for
14-days. In the third one, the MACD in a configuration of 12,9,26 -days.
In the bottom chart, we find Volume.